What your garden furniture and electricity prices have in common – True Energy
Garden furniture and electricity prices both follow the course of the year. An analysis indicates that different types of renewable energy contribute to fluctuating energy prices.
Share on
Automated, intelligent solutions can help consumers save money.
The old advice goes: Put the garden furniture out (forward) in the spring and back in the autumn. This is how we know what to do with the clocks when we change between summer and winter time. Similarly, the cheapest and most expensive electricity prices fluctuate between summer and winter.
These are among the results in an analysis carried out by True Energy.
The fluctuating electricity prices
The similarity between garden furniture and electricity prices is, in other words, that both are dependent on the weather and the season. This is particularly important for energy consumers with variable electricity contracts, that are heavily influenced by spot prices. Spot prices represents the “pure price” for electricity. The full price includes tariffs and charges.
At the same time, new electricity tariffs are being introduced. For example, in Denmark from October 1st. These new tariffs can make it even more expensive to use electricity at the “wrong” times. In other words, you can save a lot by timing your electricity consumption for the hours when the price is cheapest.
True Energy has analysed the spot price of electricity hour by hour over the last year. We have divided the analysis by region:
DK1 is Western Denmark and includes Jutland and Funen
DK2 is Eastern Denmark, and includes Zealand and Bornholm.
We have divided this year’s electricity prices into a winter and summer semester:
The winter semester runs from 1 October 2022 to 31 March 2023
The summer semester runs from 1 April 2023 to 30 September 2023
Big difference between summer and winter
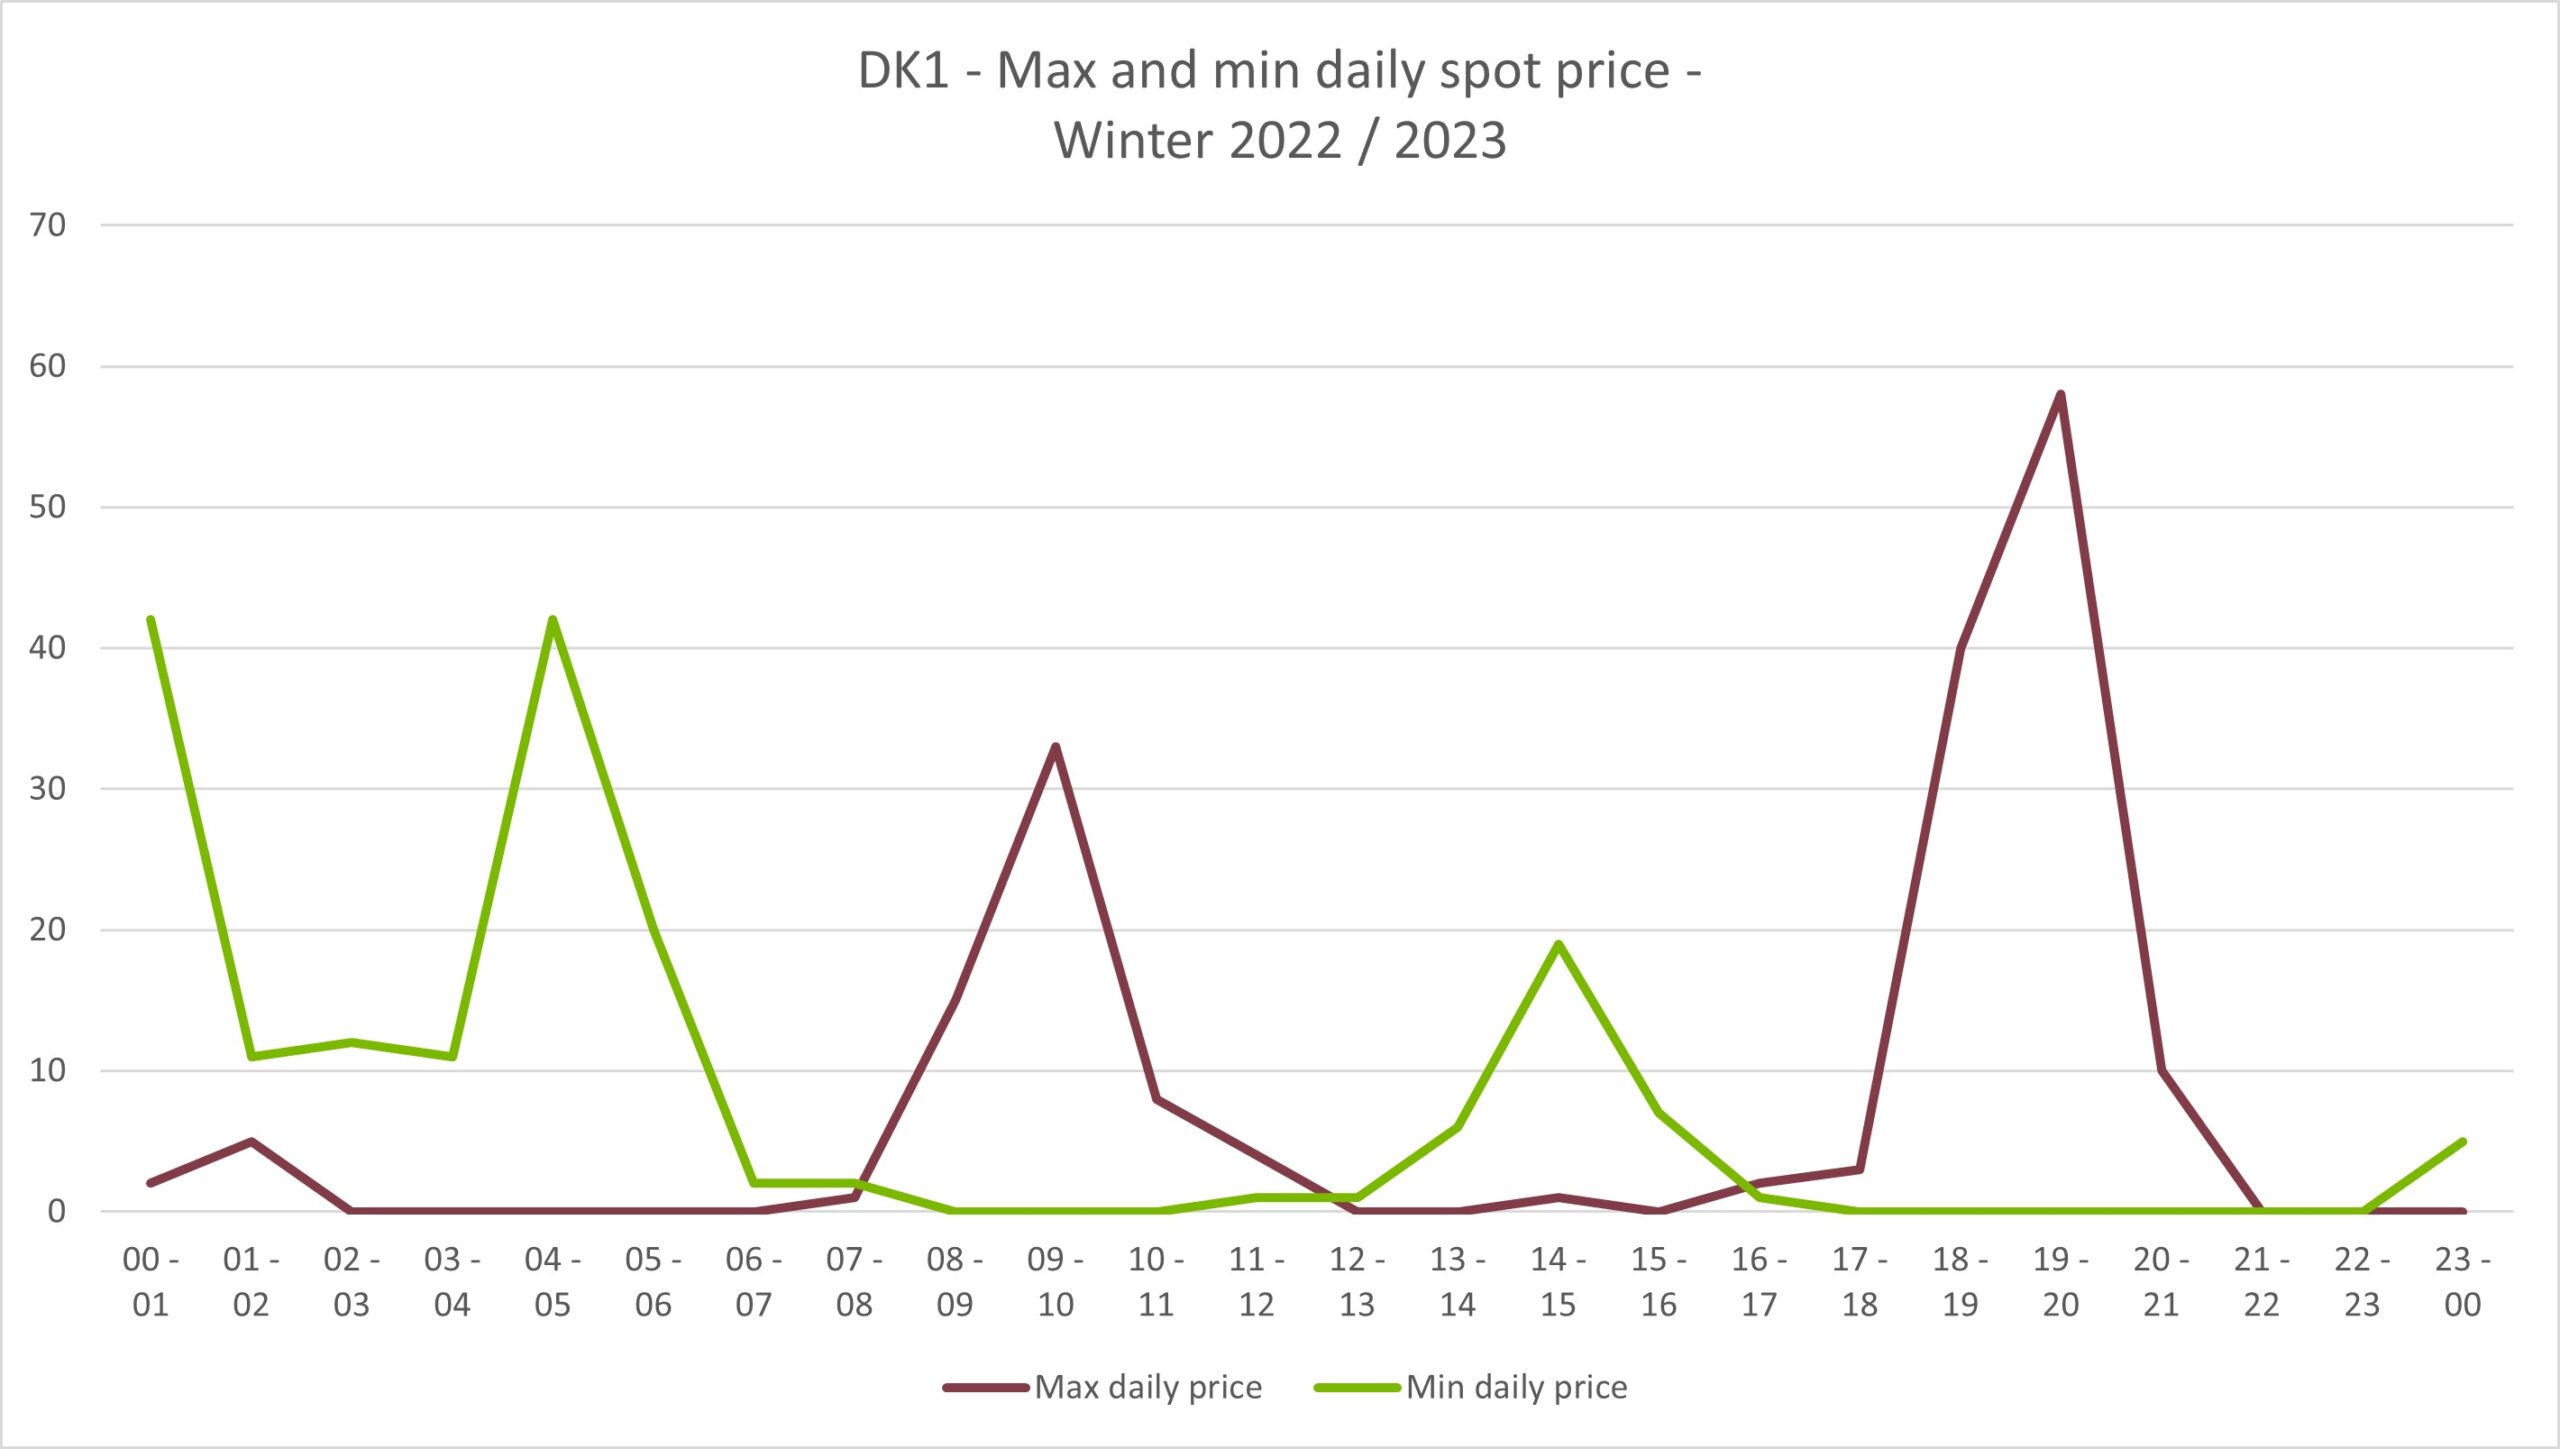
As can be seen in the graphs for DK1 below, there is a big difference between when the spot price of electricity is highest and when spot prices are lowest, depending on the time of year.
The graph above shows how many days during the winter season, the highest and lowest electricity price occurred in a given hour.
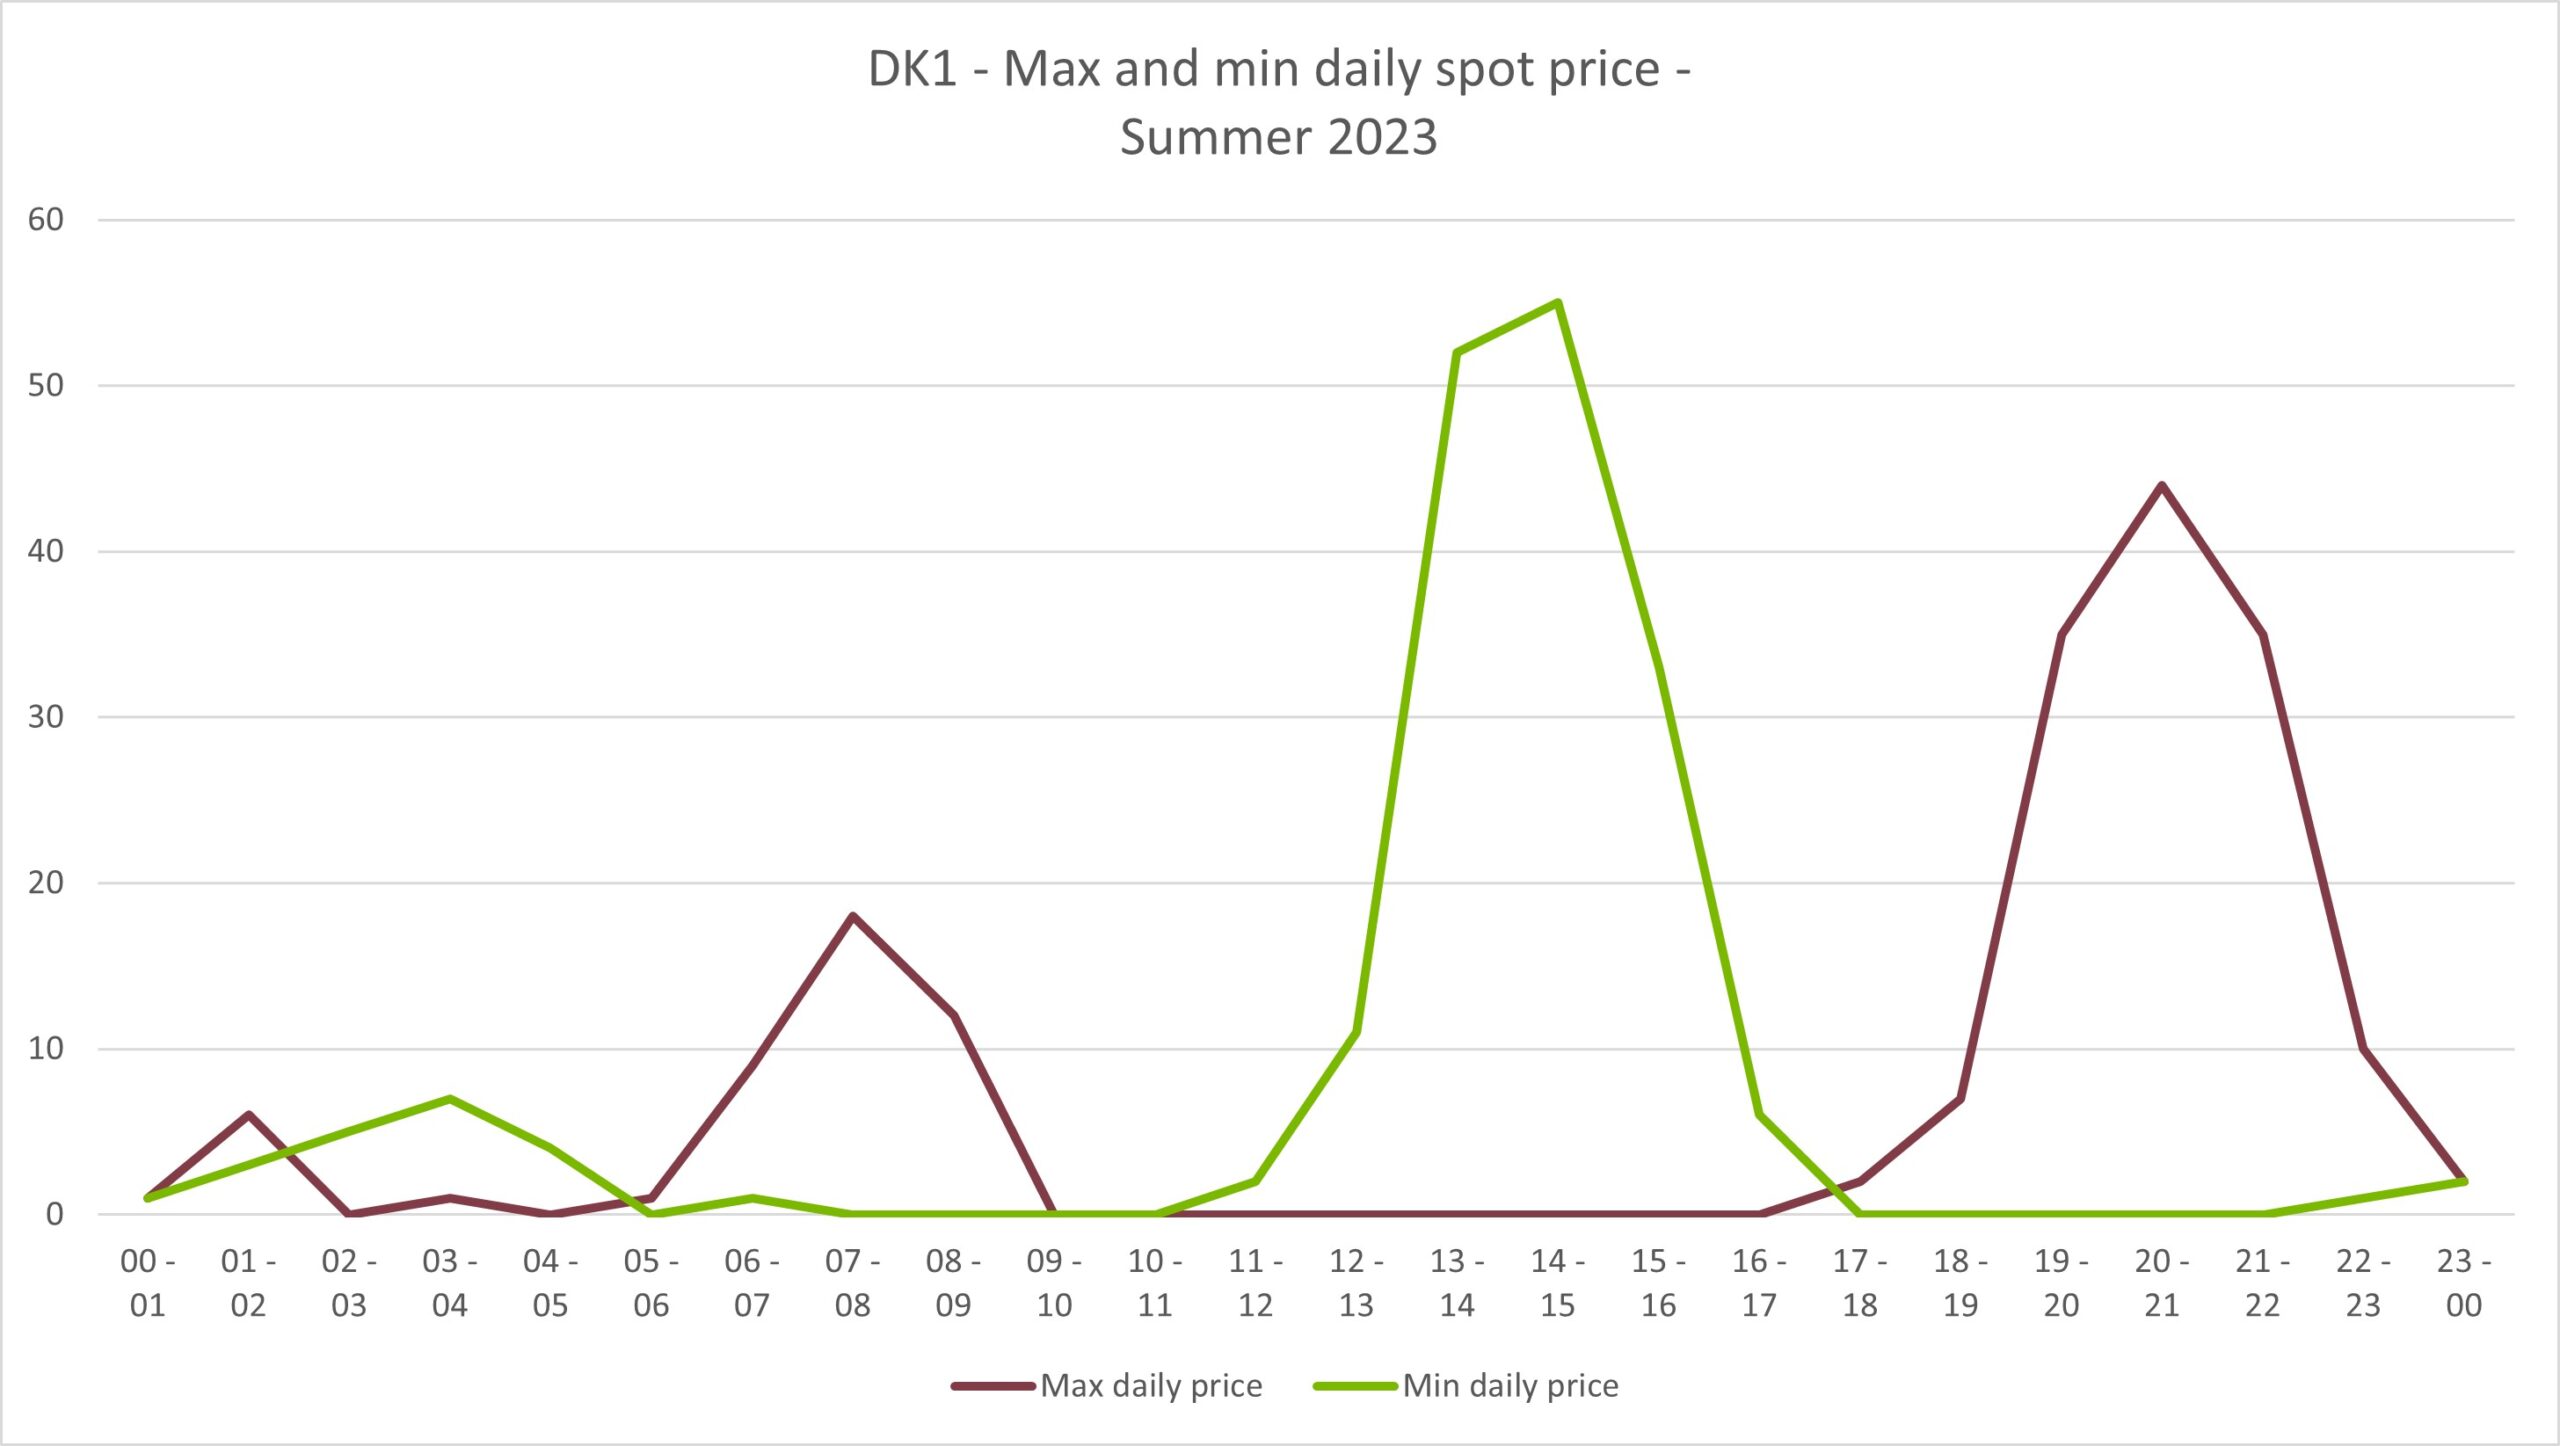
The graph above shows when the spot price of electricity was highest and lowest during the summer. As the graphs show, the cheapest hours during the winter are often at night, while the afternoon is cheapest in the summer.
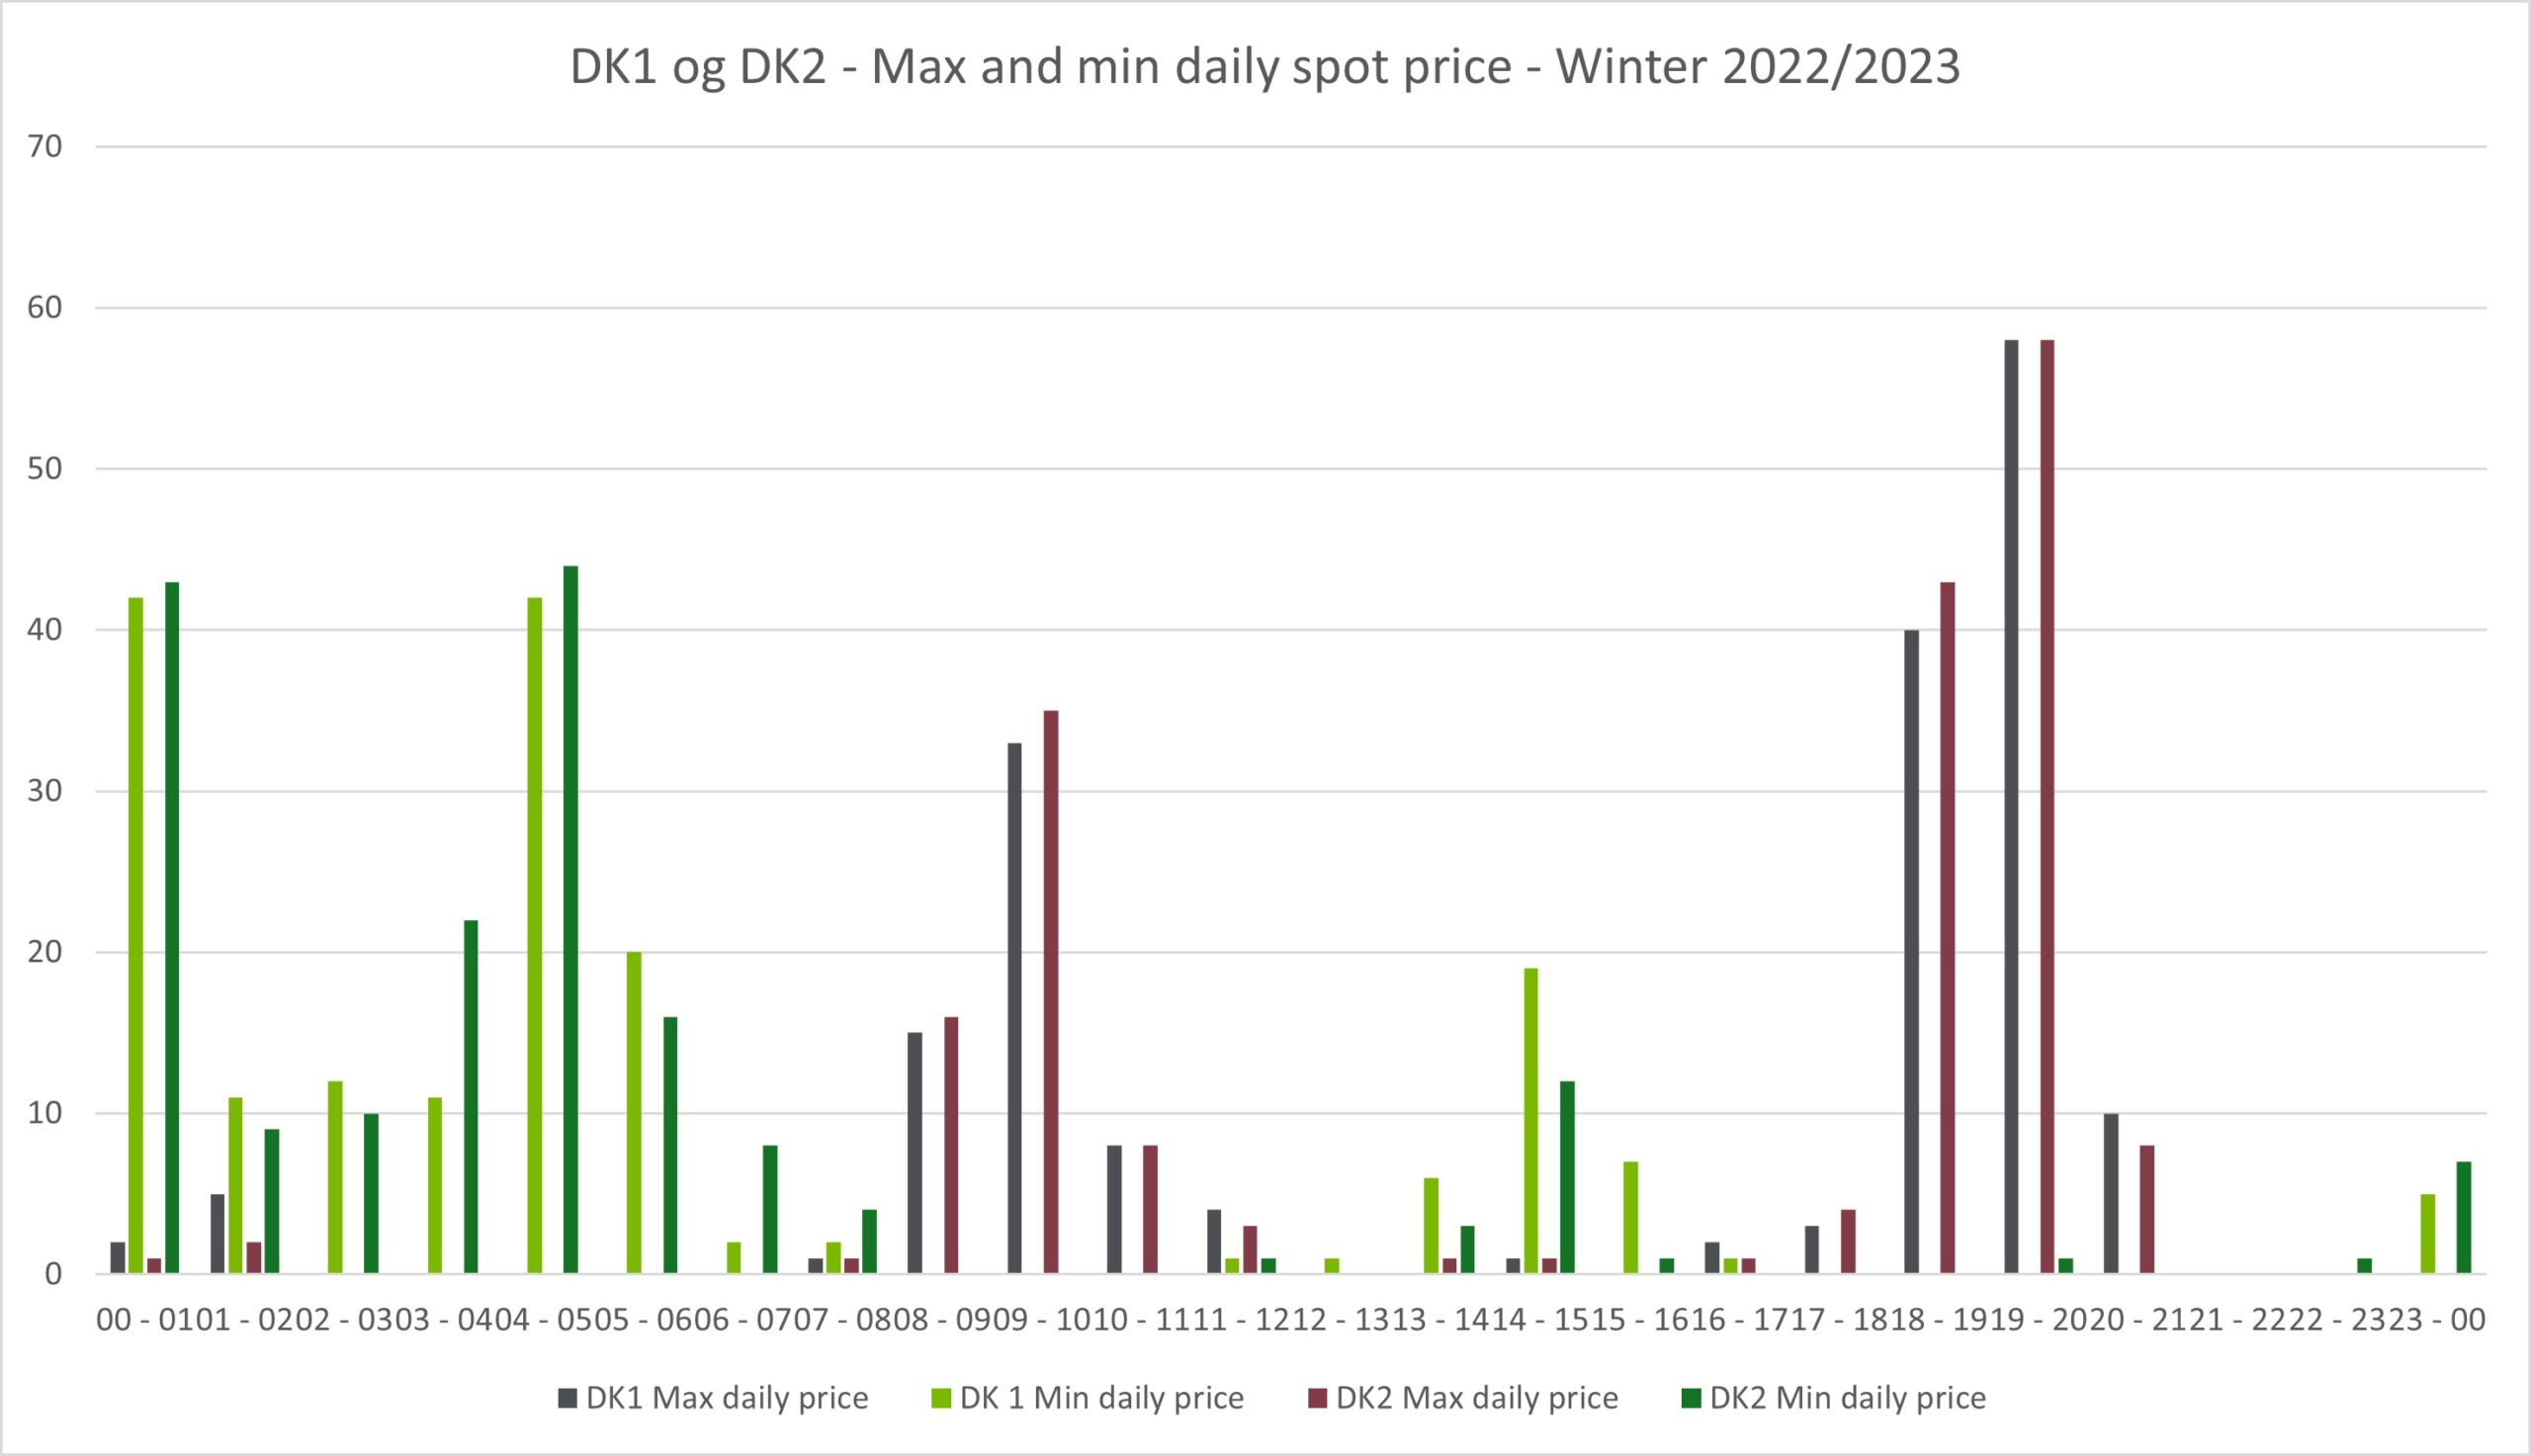
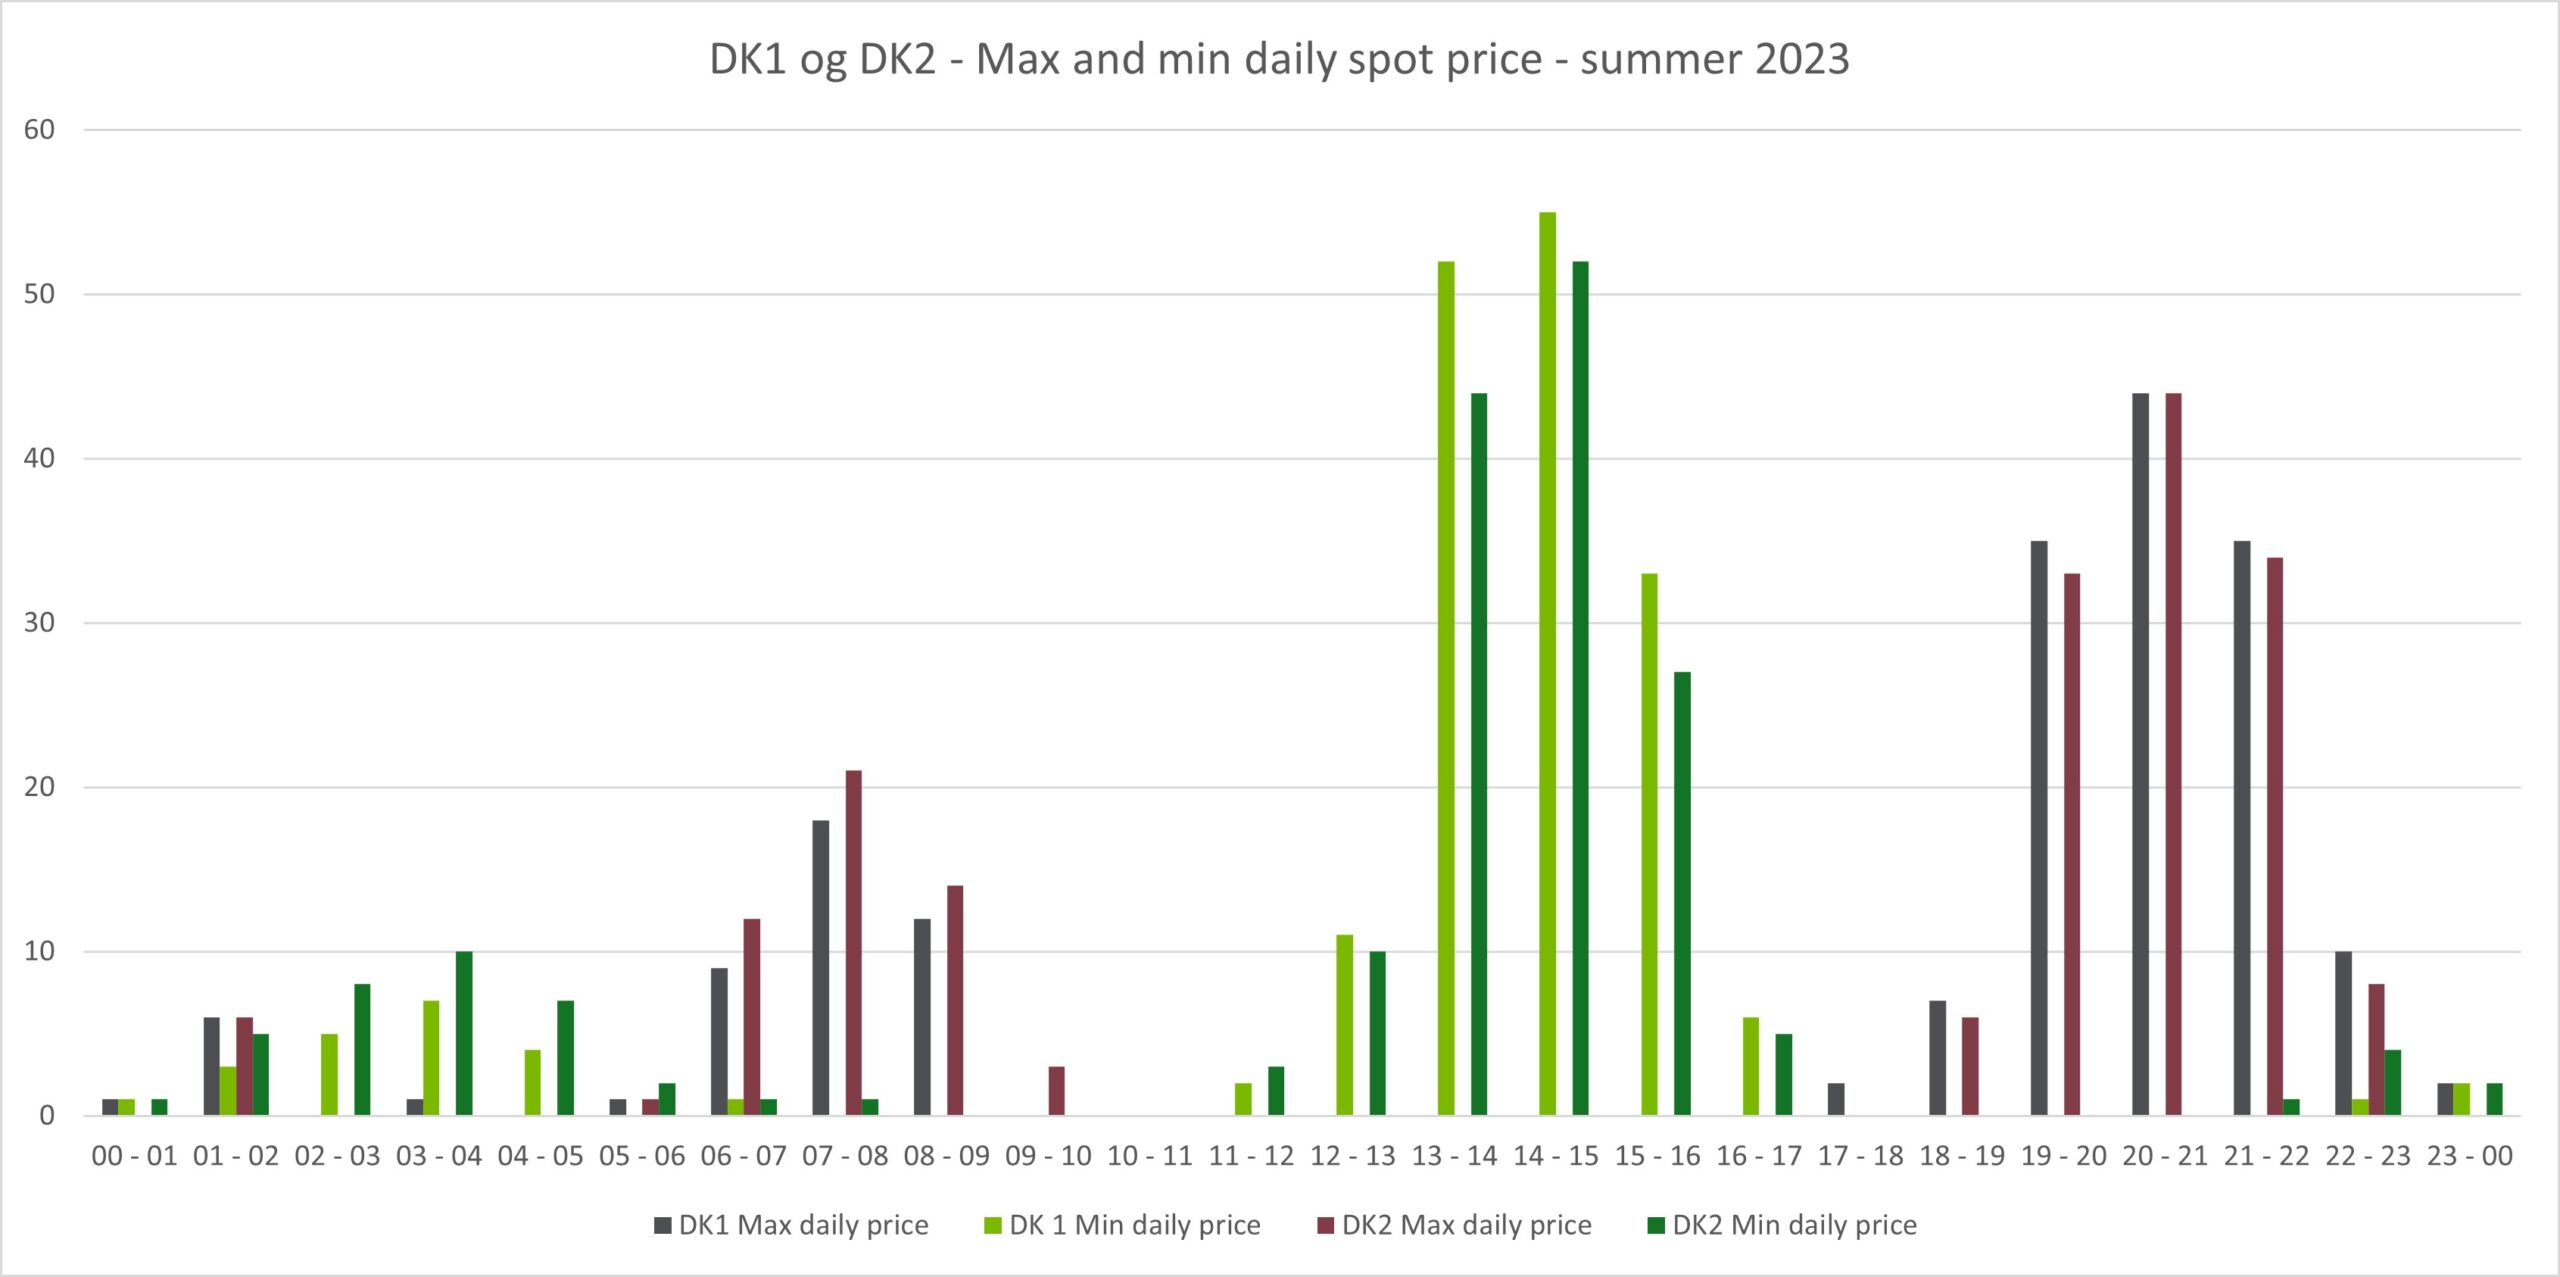
Difference between East and West As can be seen on the graph below, there is also some difference between the highest and lowest prices between east and west in the summer.
One of the underlying reasons for the price fluctuations and the differences between when it is cheapest and most expensive to use electricity is likely renewable energy. During the summer, there is greater production of electricity via solar cells during the daytime, which helps to drive the price down. In winter there is less sun, and therefore the lowest prices are usually at night.
Use electricity intelligently
The moral of the analysis is that you can save a lot by putting your electricity consumption in the hours when the price is lowest. Those hours are often either during the working day or at night. It is therefore a good idea to find ways to automate your electricity consumption via intelligent solutions. It is precisely here that True Energy’s solutions excel.
What we did
The analysis is based on data from the energy network’s data portal. Here you can find data on the spot price of electricity divided by area. We found the price of electricity hour by hour for the previous year. Data starts at the entry to October 1, 2022 and runs through the end of September 30, 2023. We analyzed that data and found the hours when the spot price was highest and lowest. Next, we divided the year into a winter half year and a summer half year and counted for each how many times specific hours had the highest or lowest electricity prices. The results can be seen in the analysis above.